Hospitality and retail businesses must continually monitor and analyze purchasing behaviors across vendors to ensure margin stability and maintain a positive P&L. In doing so, businesses can improve their purchasing based on data that can lead to informed decisions and conversations with suppliers.
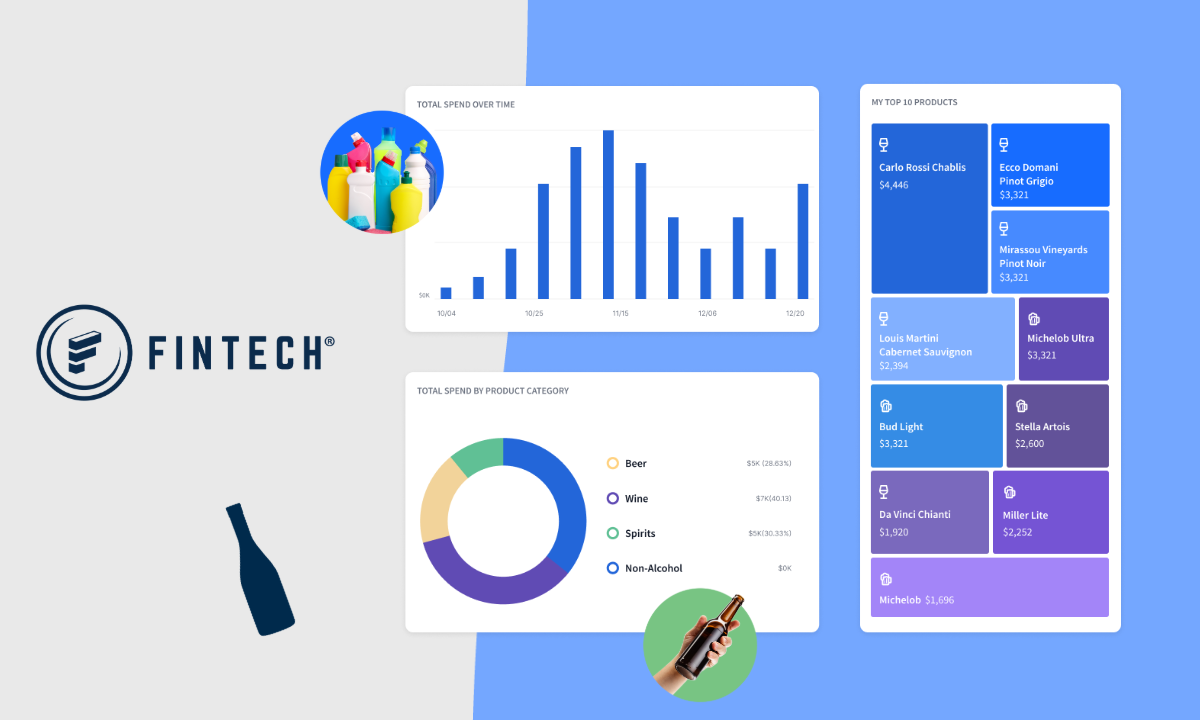
Fintech’s Spend Overview makes this simple. This built-in report allows businesses to track all invoiced purchases across both regulated and non-regulated products and vendors. By monitoring these purchases, managers can better understand their businesses as well as spending habits to look for opportunities to make changes.
Spend Overview Key Metrics
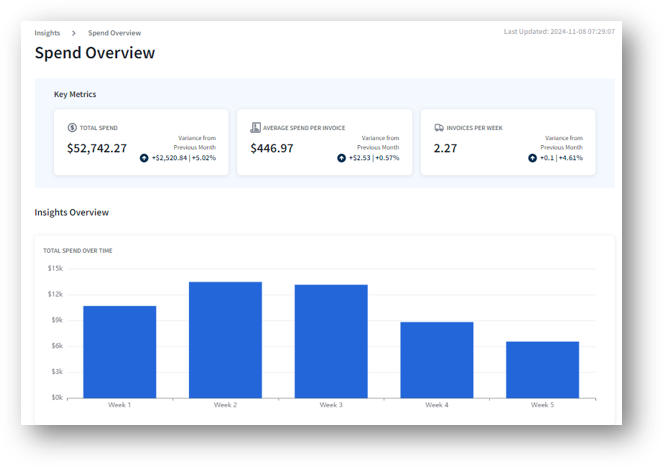
What overview is complete without some high-level key metrics? Spend Overview provides both the total and average amounts spent, including all payments, credits, and discounts. Users can quickly see the Total Spend, Average Spend Per Invoice, and Invoices Per Week at the top of the report.
The report also shows changes from the previous quarter in each category. This provides a quick glance so that if anything stands out, users can quickly research what happened.
Drill Down Further With Spend Insights
Scrolling down the report leads to the Insights Overview section. The first thing is Total Spend Over Time, which is displayed visually in a bar graph. Users can hover over the bars to see a dollar amount.
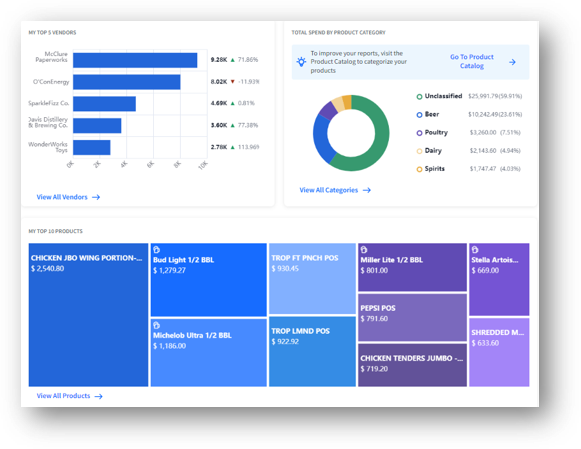
Continue scrolling down to see the Top 5 Vendors and Total Spend by Product Category, both visually demonstrated in a bar graph and pie chart, respectively. As with Total Spend Over Time, users can hover over the bars to view spending details for their top vendors.
Total Spend by Category shows spending habits across categories. For example, PaymentSource® Pro users can view spending habits across beverage categories like beer, wine, spirits, and non-alcs. PaymentSource Premium users (with access to non-alc/non-reg invoice processing) can see categories like dairy, food, and more.
Enhance Spend Overview Experience With the Product Catalog
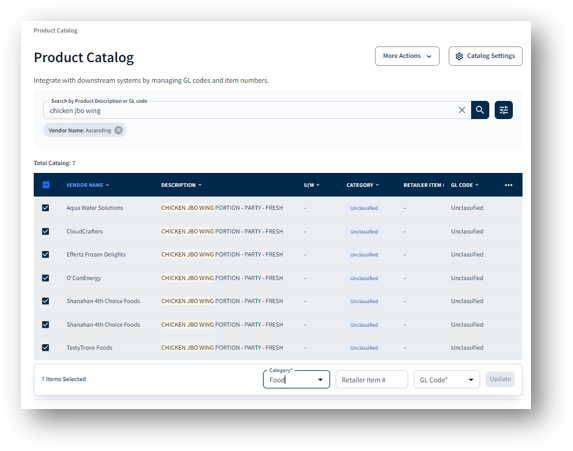
Fintech has made advancements elsewhere within the portal experience. Users can get the most out of their Spend Overview by customizing their product catalog, which helps synchronize the data to their Fintech portal. Users can bulk manage GL codes, SKUs, and product categories for all their alcohol and non-alc/non-reg purchases. There are preset categories for popular items like beer, wine, food, water, etc., and users can also create new categories that fit their business.
With the product catalog set up, the categorized products filter into the Spend Overview report. From there, users can get a more detailed look at Total Spend by Product Category across their inventory.
Why Are These Spend Insights So Important?
Having a detailed look into purchasing behaviors helps businesses identify trends and buying habits that could influence margins. This helps plan category spend more effectively and opens the door for data-driven conversations with vendors on potential quantity discounts, credits back for overpayments, and more.
Smarter purchasing decisions mean better margins with total visibility into spending across locations. Connect with Fintech to learn more about the Spend Overview report and upgrade to PaymentSource.