Fintech’s Eric Kiser (VP, Distributor Strategy) and NBWA’s Lester Jones (VP, Analytics & Chief Economist) recently hosted a webinar covering the YTD beer industry performance and comparing it to last year’s. The webinar included a general market review, a retailer purchase data profile, YTD 2023 vs. YTD 2024 for both on and off-premise markets, pack mix types (bottle/can/draft), brand rankings, and other notable categories like non-alcoholics, crafts, ciders, and others. The combined data sets from Fintech and NBWA provide a glimpse into trends and insights that inform alcohol businesses on how to serve customers better.
At-Risk Inventory (ARI) vs. Beer Purchasers’ Index (BPI)
Jones kicked things off by looking at data from NBWA’s Beer Purchasers’ Index, a monthly release that provides a strong indicator of beer purchasing activity based on distributor surveys. The BPI is the only forward-looking indicator measuring beer demand. Jones also highlighted ARI data, which serves as a measure of missed expectations of that beer demand.
With ARI and BPI combined, the beer industry sits in one of four sections:
- Expansionary: BPI > 50, ARI < 50
- Contractionary: BPI < 50, ARI > 50
- Cautious: BPI < 50, ARI < 50
- Irrational: BPI > 50, ARI > 50
The industry typically sits in the expansionary quadrant and is focused on getting to the 50-50 mark, a rare “bullseye” phenomenon, which is just about where it was for the November 2024 BPI. This is a good spot, as it indicates the market is neither bullish nor bearish at the end of the year.
Some notable takeaways from the latest BPI’s beer purchase data are that the Below Premium category hit its sixth reading in expansion territory, a record for most in a calendar year and that the Craft category had its second-lowest reading since the BPI launched ten years ago.
Beer Inflation vs. Consumer Price Index Inflation
Inflation has been a lingering mainstay, with the Consumer Price Index (CPI) on a steady incline as consumers pay more for goods and services. The good news is that beer has kept up with consumer inflation, showcasing its purchasing power at retail with consumers relative to pricing. Wine and spirits have failed to keep up with general CPI, again showing how strong beer performance is despite economic circumstances.
Retail and On-Premise Accounts Performance
There are roughly 600,000 total alcohol retail accounts in 2024. Jones examined the beer retail accounts per capita using this figure and showed 252 beer accounts per 100,000 this year. The peak was at 269 in 2017, and then there was a sudden drop to 242 in 2020 with COVID. Retail accounts have since steadily climbed out of that hole, increasing YOY to the 252 seen this year.
Beer’s performance on-premise is strong. In 2023 and 2024, over two-thirds of new beer-selling establishments were on-premise. Restaurants make up the majority of the category with 38% of new accounts, showcasing the growth in the on-premise sector in the time since the pandemic.
This is further reinforced when looking at food and beverage (F&B) spending at and away from home. For years, F&B spending at home was higher than away from home. They met briefly in the middle of 2018-2020 before on-premise F&B spending took a massive dive with all the closures from COVID. Since then, F&B spending away from home has surpassed spending at home and is normalizing at this higher rate. Consumers are out and about more often and spending their money buying beer at these establishments.
“If you’re obsessed with selling beer in off-premise accounts and wondering why you’re not winning, it’s because a lot of people just aren’t in the off-premise accounts the way they are in the on-premise accounts,” Jones said.
Fintech’s Retailer Purchase Data Profile
As mentioned, the webinar pulled a lot of data from Fintech’s alcohol invoice processing. This data creates a profile representing an anonymized aggregation of beer purchase data among 253,000 retailers and 5,184 distributors across the country, including chain and independent retailers.
Fintech processes over 971,000 invoices weekly, representing about one-third of all retailer alcohol purchases. The data used in the webinar is aggregated weekly and ends Friday, November 22.
Looking deeper into the data, the retailer profile includes over 129,000 on-premise businesses and roughly 124,000 retail accounts.
The Value of the Industry from a Sales to Retailer Perspective
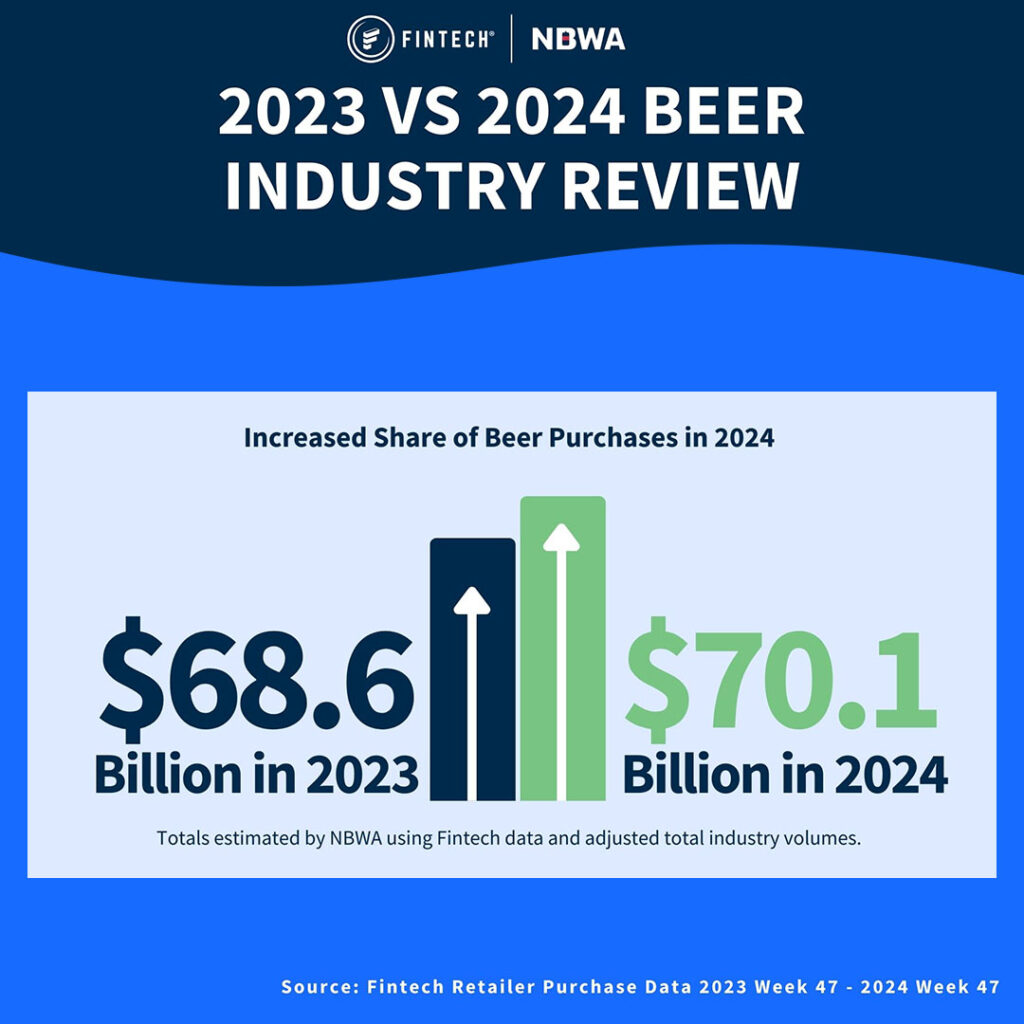
Jones spoke about an analysis conducted last year on beer sales for the calendar year, which totaled $68.6 billion. There are still several weeks left in 2024 to consider, but Jones feels optimistic about an estimated $70.7 billion in sales. He included inflation because, as noted earlier, beer keeps pace with inflation.
Kiser and Jones remarked that during their last webinar in July, which only included data through week 27, the industry looked like it would be strong throughout the rest of the year. However, it ended up flattening out, with some of the numbers dropping below 2023’s performance. There are spikes around things like Cinco de Mayo, the Fourth of July, and the NCAA’s March Madness, but these ebbs and flows differ yearly. Despite the uncertainty, Jones remains confident that sales performance through the rest of the year will be strong and bring the total ahead of 2023.
Package Shares and Value Mix Across Retailer Purchases
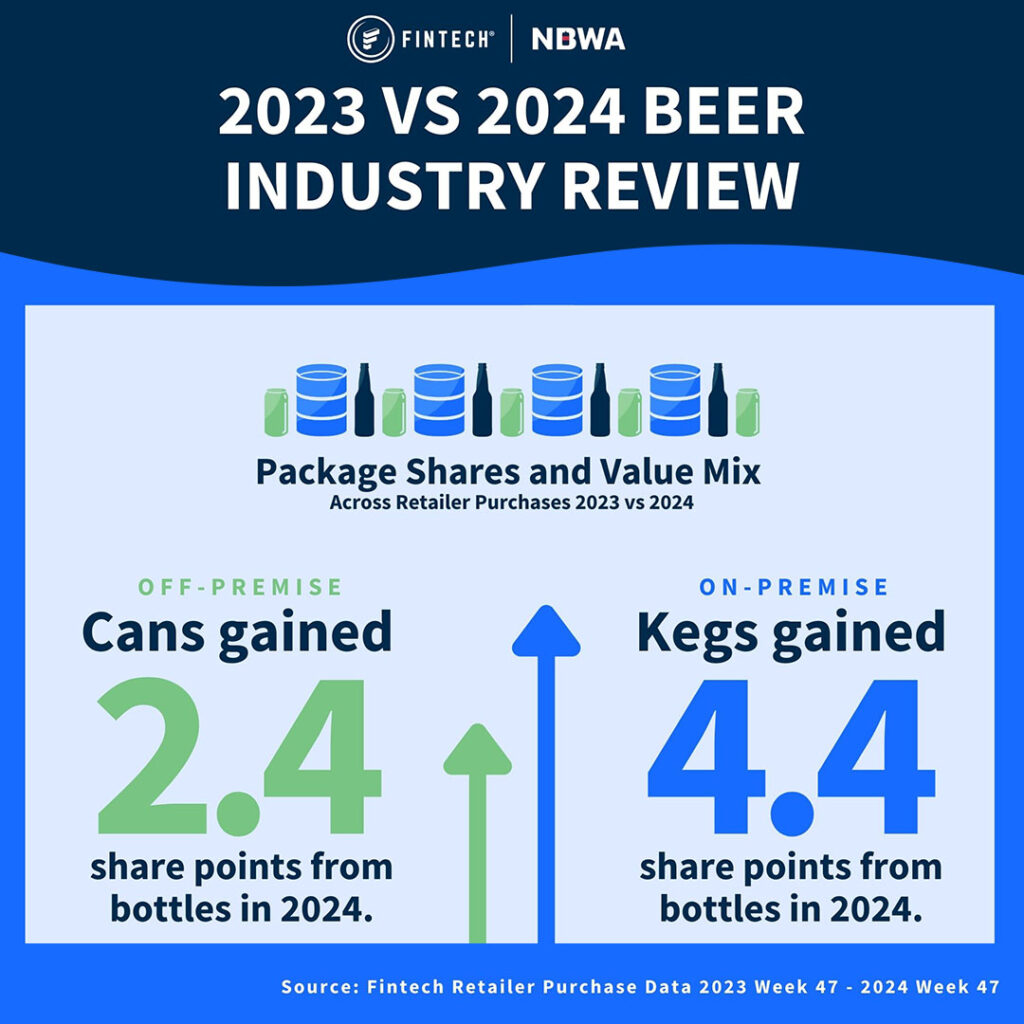
Packaging matters when it comes to beer sales. The webinar looked at package share performance across the bottle, can, and keg segments in both the on and off-premise markets. Within the off-premise, cans gained 2.4 share points from bottles. Cans still hold the majority of package shares by a wide margin, but that 2.4 share point creep reinforces consumers’ preferences at the retail level.
In the on-premise world, kegs gained 4.4 share points from bottle packages. This shows the strength of on-premise as a whole. Consumers going out prefer draft beers, and that preference is on the rise when looking at the data.
Segments Performance by Share of Dollars in Both Markets
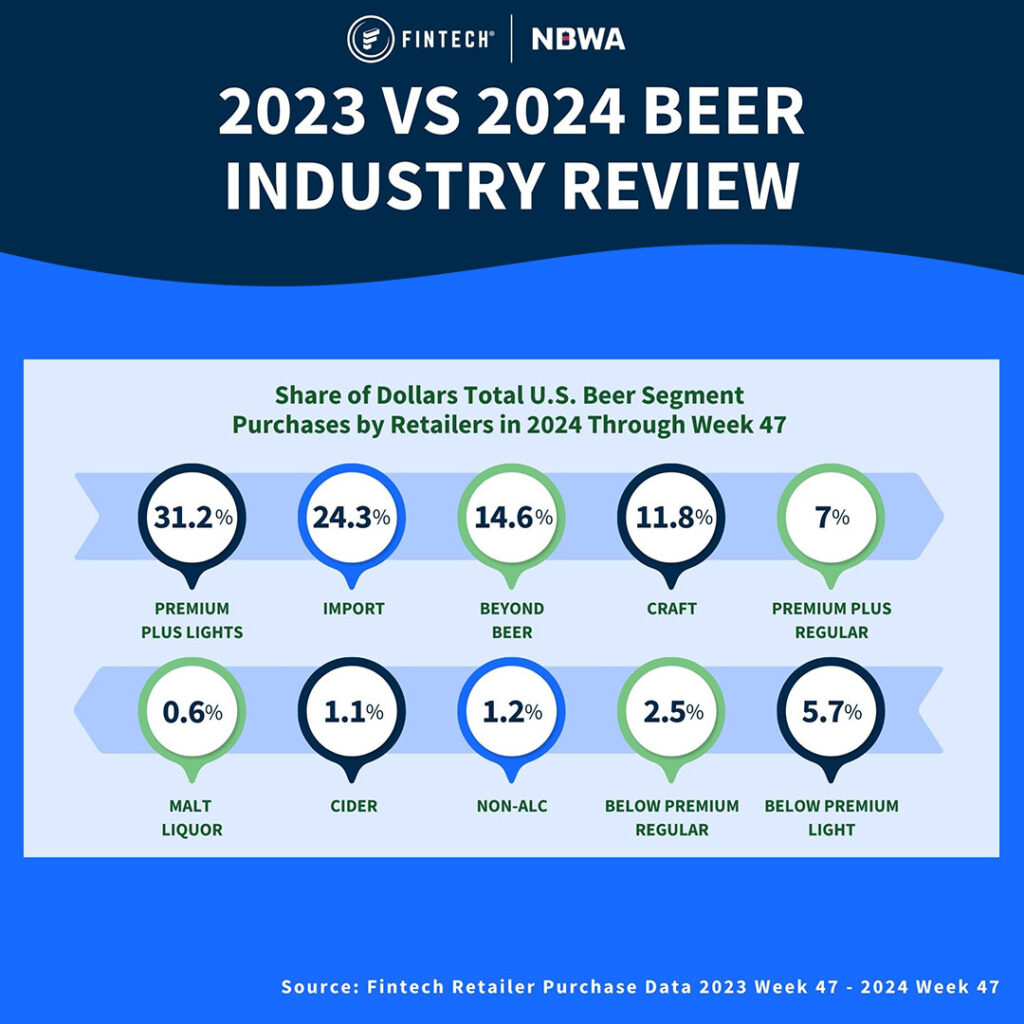
NBWA classifies ten segments of beer:
- Premium Plus Lights
- Import
- Beyond Beer (hard seltzers, ready-to drink cocktails, etc.)
- Craft
- Premium Plus Regular
- Below Premium Light
- Below Premium Regular
- Non-Alc
- Cider
- Malt Liquor
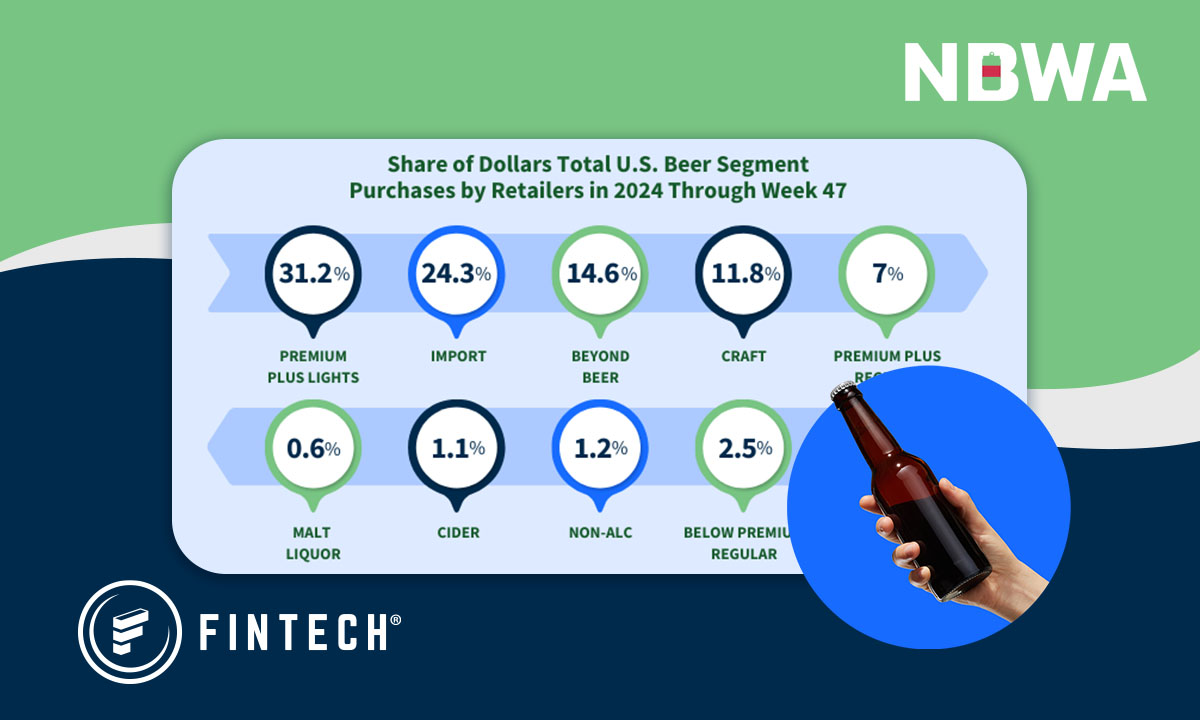
During the webinar, Kiser and Jones examined each of these segments in the off-premise and on-premise markets. In the off-premise, the biggest changes YoY came with the Premium Plus Light category, which had a -1.2 share change, and Beyond Beer, which had a +0.6 share change. Other notable changes came with Imports and Non-Alcs, both at +0.4.
The on-premise market saw some interesting changes as well. Category-leading Premium Plus Lights saw a -0.9 share change, the steepest of any segment in either market. Premium Plus Regulars had the strongest positive share change at +0.6. Below Premium Lights and Non-Alcs had the next best change, both at +0.3.
Key Takeaway – Beer is Here to Stay and Making More Noise
The data reflects net positives for the industry. Between the projected increase in wholesale sales, the uptick in F&B spending away from home, and the increases in both retail and on-premise accounts, the beer industry is trending in the right direction. Even with some stabilization in certain areas, the figures are stable at a better place than a year ago.
Be sure to subscribe to NBWA’s BPI to get monthly updates on the latest beer purchase data with segment performance, and keep an eye out for the next joint webinar with NBWA and Fintech to review how 2024 ultimately played out and what to look for in the beginning parts of 2025.
Review our beer data info-graphic gallery below to gain more valuable insights.


