With the holiday season here, alcohol suppliers and retailers need to be tuned into which products are moving off the shelves. Fintech’s competitive market analytics provide exclusive off-premises chain retail sales data from our alliance partnership with IRI so those in the alcohol business can keep an eye on both past and emerging trends. For this year’s Thanksgiving, our data shows us what consumers bought in each major alcohol category and how it compares to last year.
*IRI 36.0 Total US Multi-Outlet (4 weeks ending 11/27/22)
Whiskey Tops Spirits Category
Whiskey reigned supreme as the preferred spirit option. Over a 4-week period surrounding Thanksgiving, whiskey took up approximately 35% of the dollar share with $240 million in sales nationwide. Vodka and tequila trailed behind with 20% and 10% of the dollar share. Compared to last year’s Thanksgiving period, whiskey saw a -0.19% change in total sales dollars.
Perhaps the biggest takeaways are the sharp rise in spirits-based seltzers and premixed cocktails with 79% and 18% increases in dollar sales, respectively. There have been noticeable improvements in the ready-to-drink (RTDs) category (check out our latest blog on RTD market growth) with more top brands exploring new recipes and cocktail creations.
Red, Red Wine
Wine is often the preferred tableside beverage option for Thanksgiving meals. In the Wine category, reds came out on top overall with cabernet sauvignons in pole position a t approximately $2.1 billion in sales. Chardonnay topped the white wine segment and had $1.9 billion in sales. Pinot grigio and pinot noir claimed spots #3 and #4. The top 4 wine types each reported positive changes in dollar sales versus last year, showcasing the increase in consumer purchasing with alcohol overall.
Our competitive market analytics also provide insights into the highest price point items in terms of average cost per case. In this metric, blanc de blancs champagne led the pack at just over $2,000 per case. Late-harvest wines came in second at $1,960 per case on average and violettas followed in third at $1,622.
Cabernet sauvignon and pinot noir typically lead the red wine segments. It is also common for there to be an uptick in red wine sales over the colder winter months. For example, the data shows spikes in cabs around the time leading up to Thanksgiving with them leveling back to standard performance afterward.
We will see if this trend continues once the data sets for Christmas and New Year’s are available.
Domestic Premiums Top Beer Category, but Non-Alcoholics on the Rise
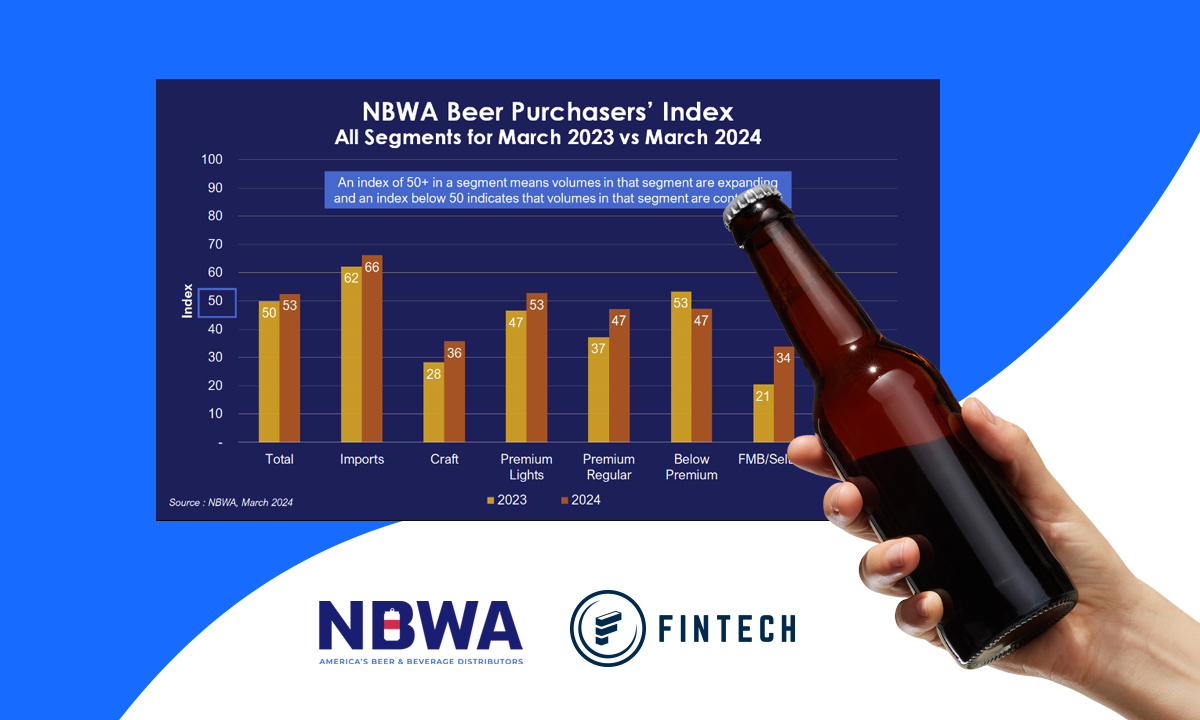
In the Beer category, the domestic premium segment took the top spot with 26% of the dollar share at approximately $381 million nationwide. Imports followed behind with domestic sub-premiums and craft beers rounding out the other spots. The winter months normally show a spike in seasonal flavors like pumpkin beers and other specialty options, but not enough to dethrone the domestic premium category.
While domestic premiums led in dollar sales, it was flavored malt beverages (FMBs) that led in terms of dollar sales trend compared to last year. FMBs have become a mainstay in the bev alc world and their 21% increase in dollar sales compared to last year reflects that.
In terms of average price per case, ciders lead the charge at $46.59. Other notable categories include crafts at $40.72 and FMBs at $37.31. While these segments are smaller in terms of dollar share, their value in average price per case stands out as a positive for suppliers.
Another interesting note out of the Beer category is the rise of non-alcoholic beer options. There was an 18.62% increase in dollar sales over the Thanksgiving period compared to last year. With a cultural shift towards exploring a “sober-curious” lifestyle, particularly among Gen Z consumers, their impact on the market is evidenced by the performance of non-alcoholic beers.
Data-Driven Insights for Alcohol Businesses
While the normal heavyweights retained their top spots over the Thanksgiving period, there were a couple of revealing insights into the changing shape of the bev alc market. The holidays are an interesting time when we see an increase in seasonal and specialty items across the Wine, Spirits, and Beer categories. Coupled with the trends in groups like RTDs, FMBs, and non-alcoholic drinks, there are some interesting opportunities to capitalize on other offerings.
We will see which alcohol types claim the top spots come Christmas and New Year’s.
Fintech’s alcohol data gives access to sales insights around the holiday period, your target geographical areas, and at an even more granular level based on product type and brand. Learn more about our competitive market analysis and how it can help you turn off-prem sales data into actionable intelligence for your business.